
The Booming Global Market You’ve Never Heard Of: Inside Digital Service Exports
From small nations to global giants, discover which countries are thriving in the booming digital market in this data-driven analysis


To the surprise of absolutely no one, digital services have become a big contributor to economies around the world. In this article, we’ll explore Digitally Delivered Services (DDS) from various regions of the world and analyze their contributions over time.
Digital trade has transformed the global economy, enabling even the smallest nations to reach international markets. While most discussions center around goods traded on platforms like Amazon or Alibaba, digital services—like software, cloud computing, and insurance services—have emerged as the backbone of the digital economy. I will be using data from the World Trade Organization to shed light on how countries have contributed to this booming sector from 2005 to 2023.
First, let’s define what are Digital Delivered Services. DDS are defined as services that can be remotely over computer networks such as the internet, mobile apps, emails, voice and video calls, etc.
Insight Summary
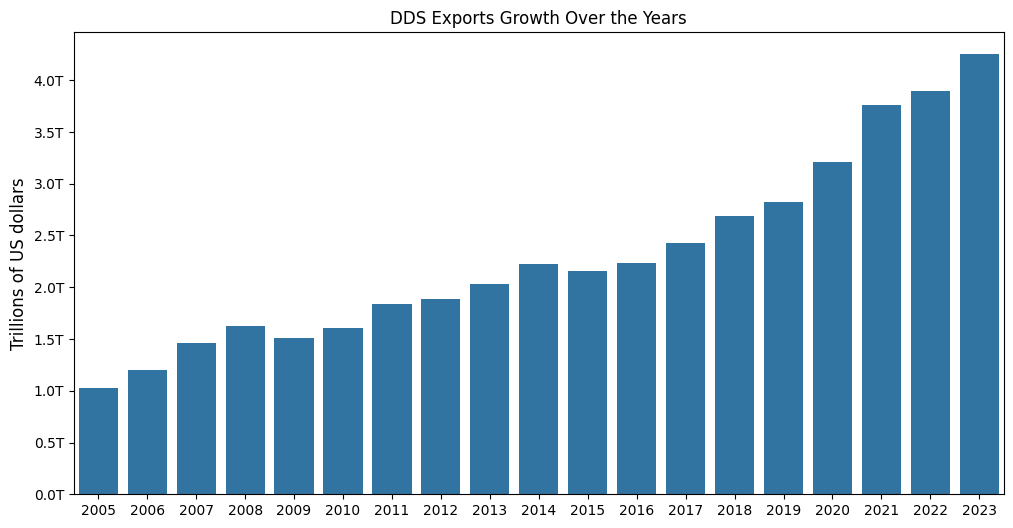
Big Value: The value of DDS has increased 4x since 2005, with an average annual growth rate of 8.2%
A Game of Few: A handful of economies dominate digital service exports, however, there are some surprising inclusions
Surprising Contributors: Certain developing nations show exponential growth, driven perhaps by investments in IT infrastructure. Ireland caught me by surprise as it’s been one of the top 3 biggest exporters in recent years
Trends Over Time: The global digital trade landscape has shifted in response to technological advancements and global crises, such as the COVID-19 pandemic, I suspect the rise of AI will accelerate this trend
Methods
This analysis was made using data by the WTO.
Trends Analysis: We’ll look at export growths over the years 2005-2023
Comparative Analysis: How do different regions of the world contribute to DDS exports? Additionally, we’ll look at a breakdown for each type of service to find interesting trends.
Rising Players: What countries have experienced the most growth since 2019?
Context: This analysis focuses exclusively on "Mode 1" services: Mode 1 refers to the supply of a service from one country to another without the need for the service provider to be physically present in the country of consumption, in other words, these are fully digital in nature.
Growth Over Time
If there’s a key insight that can be drawn from this analysis is that there’s a ridiculous amount of money involved in DDS. Furthermore, the proliferation of IoT devices has acted as an enabler of DDS exports that only accelerated during the COVID-19 pandemic. The graph below shows a sustained increment in the values of Digital Services over the years resulting in a 4x growth in the last 20 years. I don’t anticipate this trend to go down, as a matter of fact, I’m curious to see how AI will have a drastic impact in accelerating and increasing the value of exports in upcoming years.
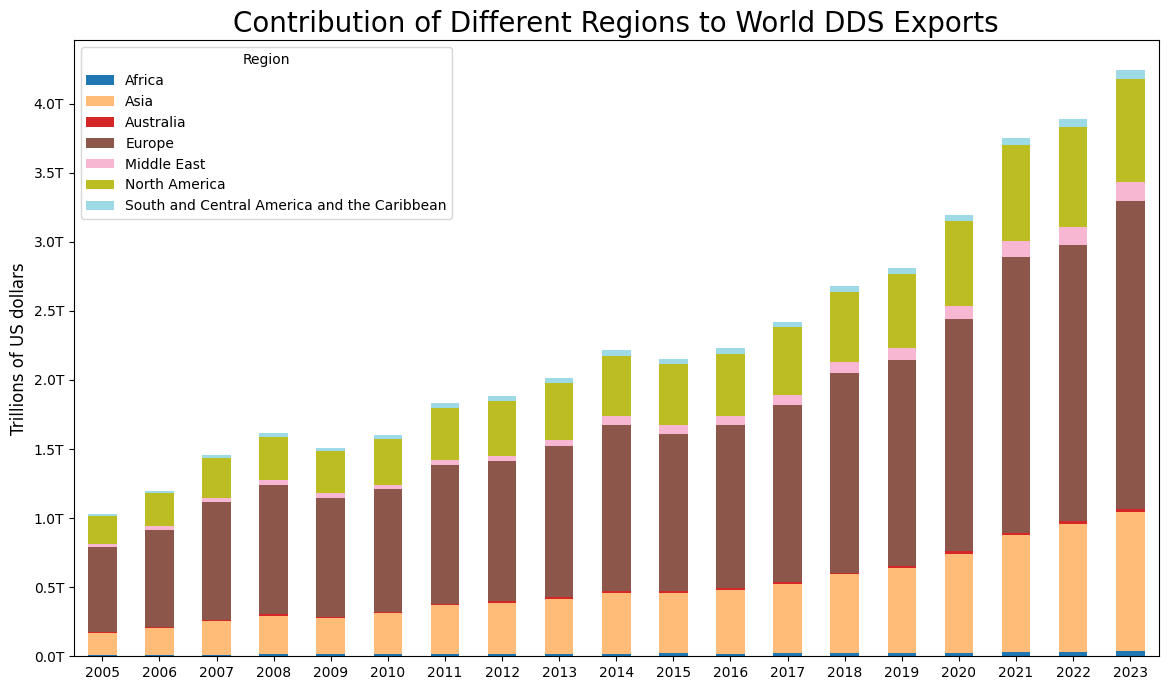
Now, let’s look at different regions across the globe to see how they contribute to the overall big picture. I found this view interesting for numerous reasons:
You can clearly see Europe is the dominant player.
I was honestly surprised by North America’s contributions compared to Asia; I did not expect it to be that similar, in fact, I was expecting Asia to be in 1st place overall.
I’m sad to see the minuscule contribution of Latin American countries.
Analysis By Sector
The data includes the following sectors or categories for DDS:
SF: Insurance and pension services
SG: Financial services
SH: Charges for the use of intellectual property
SI1: Telecommunications services
SI2: Computer services
SI3: Information services
SJ: Other business services (R&D, professional and management consulting services)
SK: Personal, cultural, and recreational services
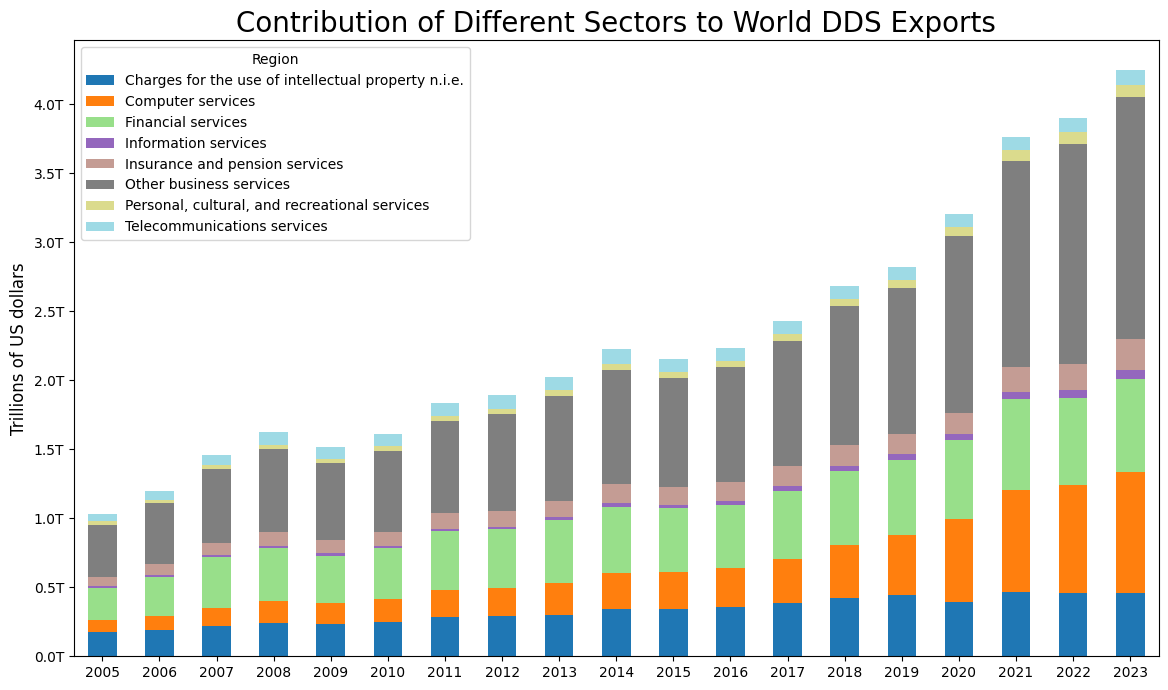
The plot below reveals that the largest contributors to DDS exports over the years have consistently been Other Business Services, Computer Services, and Financial Services. These sectors dominate the landscape, reflecting their critical roles in the global digital economy.
Perhaps is no surprise that a versatile, if ambiguous, category such as Other Business Services stands out as a contributor, maybe due to increasing demand for R&D as technology matures.
Similarly, the consistent growth in Computer Services highlights the rising reliance on software and digital infrastructure. You can see a moderate increase in this category post 2019, presumably due to the COVID-19 pandemic.
I was surprised to see that the “Personal, cultural, and recreational services” category is not really a big player, this category includes music and video streaming services, per the WTO report. You would think that in the streaming era, this category would be a big contributor; however, data tells the true story once again.
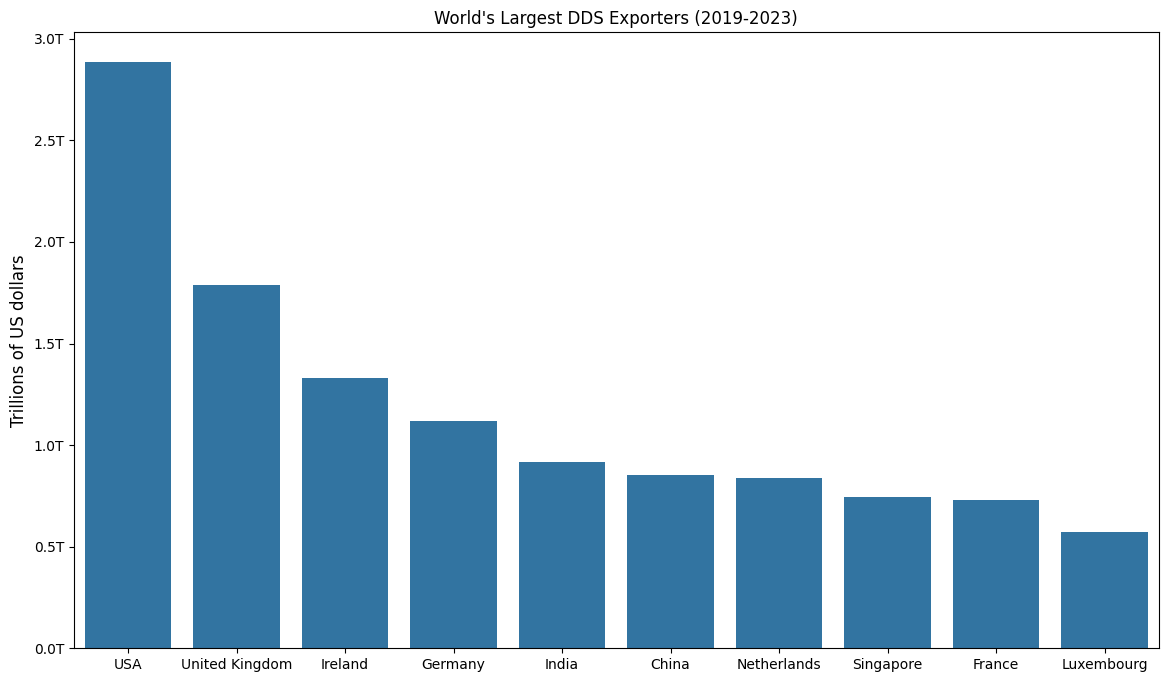
Top Exporters in the Last 4 Years
Now, let’s explore which countries have been the largest contributors to DDS exports in the post-pandemic era. For this analysis, I focused on export data from 2019 to 2023. The US remains the undisputed leader, but other countries have experienced significant shifts, with some emerging as surprising key players in the post-pandemic digital economy.
United States: Continues to lead as the global leader in DDS exports, thanks to its strong digital infrastructure and leadership in tech services.
Ireland: Surprises by securing the third spot. I think this warrants a deeper exploration of what factors may have driven this significant shift.
Luxembourg: Another surprise was the appearance of Luxembourg in the top 10. I think this emphasizes the potential growing role of smaller economies in the global digital services trade.
Biggest % Growth in the Last 4 Years
Finally, let’s look at those countries that may not have a large number of absolute value of exports but that have seen the greatest increase by compound annual growth rate (CAGR). CAGR is a business, economics and investing term representing the mean annualized growth rate for compounding values over a given time period. I calculated the CAGR rate using the following formula:
Looking at the data we find that the results are pretty remarkable, these countries have experienced a massive growth in the last 4 years. The following conclusions can be drawn:
Most of the countries have grown an order of magnitude in the last 4 years
There are some interesting regional patterns. Many of these fast-growing countries are located in Africa and Eastern Europe/Central Asia.
The high percentage growth in these nations might be due to starting with small total export values.

Remember that a small export value can yield a high CAGR, but that doesn’t necessarily mean the absolute value is substantial. However, this does suggest an encouraging trajectory.
I’m also including a table that shows the value of total DDS Exports (in Millions of USD) of these countries for context and better understanding.
Conclusion
As we’ve seen, the Digital Export landscape is evolving rapidly, with some countries seeing impressive growth. I think one of the most important aspects of this analysis is that while there are established powerhouses such as the US and the UK, there are also emerging players making notable strides. This is evidence that the global digital economy can act as a sort of game equalizer.
Lastly, one of the reasons that drove this data story was to highlight that as content creators on this platform, we are actively contributing to the global digital economy. In other words, all of our work is included in those massive numbers I just showed you. Every piece of content, whether a post, article, or analysis, adds to the broader picture of digital information exchange. It may not be seen as much in comparison to top corporations, but the more we create and share, the bigger impact we have on this ever-growing ecosystem.
So, as you write your next post, remember you’re not just adding value to your audience, you’re also part of the larger digital economy that’s rapidly transforming the world.
If you enjoyed this analytical dive into DDS exports, it would mean THE WORLD TO ME if you subscribe, share your thoughts, and join the conversation as we explore more data-driven stories together!
Tools used: Datawrapper, Python - Pandas, Seaborn, Numpy.
Thanks for reading! ✌
A fun read!
Of course, you can't cover all intricacies of global trade in one article. Luxembourg is a very small country (600k people), it traditionally shows up on these lists because of companies' tax avoidance. Same for Ireland, and probably Netherlands and Singapore too. For example, Facebook is known to funnel its global (non-US) revenue through Ireland for this reason.